Published: 26 October 2026 | Author: Team JanVayu | Reading time: 7 min
CEEW, the Council on Energy, Environment and Water, has posted a chart on LinkedIn titled "Delhi's air pollution peaks twice each winter". It plots Delhi's weekly average PM2.5 from CPCB data, May to April. The first peak, 260 µg/m³, is labelled as the start of stubble burning and sits above the 250 that CPCB's index calls Severe. The second, 247, is labelled winter biomass burning. The chart's note says the values are averaged over 2023 to 2026, and that weeks after September are averaged over 2023 to 2025.
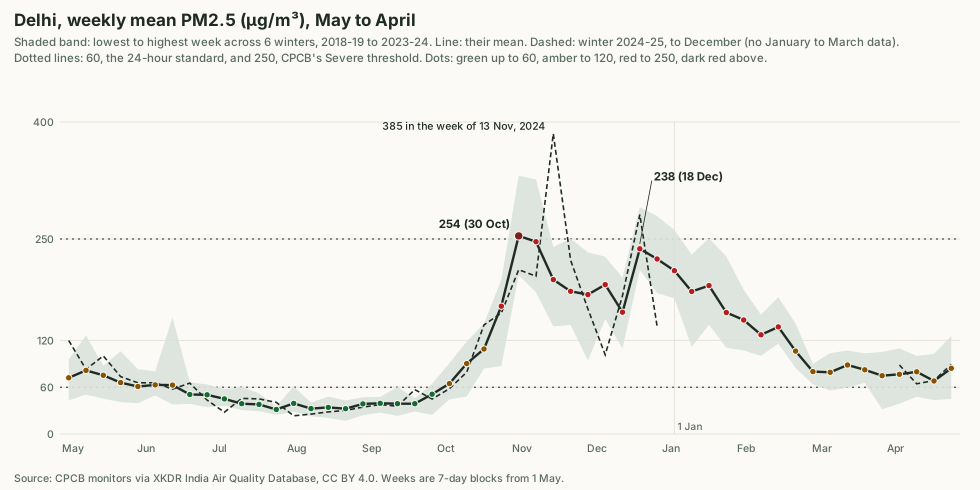
CPCB's monitor data for Delhi reaches back to 2018, so we drew the same chart for six winters, one line each, instead of one average. The shape and the scale agree with CEEW's. Three things do not carry over from an average to a winter. One is how high the first peak goes, another is whether a single winter shows two peaks, and the third is what causes either one.
What agrees with CEEW
The six-winter mean sits at or below 60 µg/m³, the 24-hour standard, for fifteen straight weeks, from 19 June to 1 October. The lowest week of each winter ran between 17 and 28, with a mean of 23, close to the 27 CEEW gives for the monsoon. The mean peaks at 254 in the week of 30 October and at 238 in the week of 18 December, against CEEW's 260 and 247, from different years.
CPCB's own bulletins give the same ordering in another unit. Pooled over 2016 to 2025, Delhi had 73 Severe days in November, 50 in December, 32 in January and 7 in October, out of about 300 days recorded for each month. It had 168, 179 and 167 Very Poor days in November, December and January. That count is of the AQI, which reports whichever pollutant scores worst, so it checks the pattern and says nothing about the PM2.5 figures.
What the average hides
Each winter has its own first peak, and it is higher than the mean of the winters.
| Winter | First peak (week of) | Lowest week between | Second peak (week of) |
|---|---|---|---|
| 2018-19 | 264 (6 Nov) | 160 (13 Nov) | 291 (18 Dec) |
| 2019-20 | 331 (30 Oct) | 94 (27 Nov) | 257 (25 Dec) |
| 2020-21 | 326 (6 Nov) | 135 (11 Dec) | 229 (18 Dec) |
| 2021-22 | 290 (6 Nov) | 148 (4 Dec) | 247 (18 Dec) |
| 2022-23 | 269 (30 Oct) | 110 (11 Dec) | 230 (8 Jan) |
| 2023-24 | 267 (30 Oct) | 156 (4 Dec) | 231 (25 Dec) |
The first peaks average 291, and every one is above 250. The six-winter mean reaches only 254, because the winters do not peak in the same week and averaging blends a high week with its lower neighbours. A reader of the average would conclude the first peak just touches Severe. In every complete winter at least one week was above it, and in 2023-24 two were. The second peak averaged 247 and cleared 250 in two winters of six.
Winter 2024-25 went higher than any of them. The week of 13 November 2024 reached 385. That winter is incomplete, so it enters no average.
The peaks also sit inside a long season. Weekly means were above 120, the bottom of CPCB's Very Poor band, for 13 to 19 weeks of each year.
Does each winter have two peaks?
The title says yes. The data support something narrower.
Every winter in the table dips between its two highest weeks, by 32% to 63% of the lower peak. That looks like two peaks, and it is also what a noisy series does. We took each winter's 15 weekly values from 16 October to 28 January, shuffled their order at random thousands of times, and measured the same dip. Shuffled weeks give a dip of 30% or more in 91% of draws, with a median of 50%. The real winters' median is 41%. A dip between two highs is therefore no evidence of a second peak in a single winter.
Two things survive the test. The first is the dip in the average of the winters. Resampling the six winters gives a dip of 28% to 42% in the average (5th to 95th percentile), so the mid-December trough in the mean, 156 in the week of 11 December, is not an accident of one winter.
The second is timing. The first peak falls in the week of 30 October in three winters and the week of 6 November in the other three. The second falls in the week of 18 December in three winters, 25 December in two and 8 January in one. Diwali fell between 24 October and 14 November over these winters, a spread of three weeks, while the first peak week moved by one. In 2020-21 and 2023-24 the peak came before Diwali. Diwali does not set the date of the first peak, though it can add to it in the week it falls.
Why the peaks happen
CEEW labels the first peak stubble burning and the second winter biomass burning for warmth. A concentration chart carries no sources, and the published work points in several directions.
- CEEW's own blog of 22 May 2026 says weather helps explain why Delhi's autumn is far worse than its spring for similar farm fires. Average boundary-layer height in Delhi in the rabi season is twice its kharif height, and north-westerly winds in October and November carry smoke from Punjab and Haryana.
- Mangaraj and colleagues (npj Climate and Atmospheric Science, 2025) measured with 30 low-cost sensors in September to November of 2022 and 2023. They put crop residue burning over Punjab at about 14% of Delhi-NCR's PM2.5 in October and November 2022.
- Nandi and colleagues (npj Clean Air, April 2026) modelled September 2019 to January 2020. The residential sector was about 53% of PM2.5 over Delhi, and secondary particles about 58% in December and January. Crop-residue burning controls inside Delhi-NCR alone cut Delhi's PM2.5 by 2 to 3%. A 50% cut in residential emissions with an airshed-wide ban on crop-residue burning cut it by about 30%.
The residential result fits CEEW's second label. We read the abstract and the results text, not the supplement, so we cannot say how much of the residential share is burning for warmth and how much is cooking. Nandi and colleagues also describe winter episodes as intense emissions meeting low winds, inversions and shallow boundary layers, which is weather. Our de-weathered series for Delhi, described in "Was it policy, or was it the wind?", covers September and October of 2018 to 2022 and does not extend to this weekly series. We cannot say how much of either peak is weather.
Where the numbers come from
The data are the India Air Quality Database of XKDR Forum, which carries CPCB's continuous monitors (CC BY 4.0). A day at a station counts if it has at least 18 hourly readings. A day for the city is the mean of the stations reporting, and at least 10 did, up to 39. A week is a block of seven days counted from 1 May, so a winter is not cut in two on 1 January. The grey band and the bold line use the six complete winters, 2018-19 to 2023-24.
Two gaps limit the chart. The archive has no CPCB data for January to March 2025, so winter 2024-25 is drawn to December only. Its CPCB feed also stops on 1 September 2025, which is why we say nothing about winter 2025-26 or about the 2025 weeks CEEW's average includes. The network grew over the period, with 13 to 37 stations reporting a day in 2018-19 and 20 to 39 in 2022-23, so levels across winters are not strictly like for like.
The grey band is the range of the six winters. Before crediting or blaming a policy for a week outside it, check the weather, as we argued in our El Niño post.
Sources
- CEEW, LinkedIn post "Delhi's air turns twice each winter, and only the first turn gets the headlines", with the chart "Delhi's air pollution peaks twice each winter" (chart by Dhruv Korula Joseph), seen 26 October 2026 as a screenshot, so no permalink is given here
- XKDR Forum, India Air Quality Database, CC BY 4.0
- JanVayu, Delhi weekly PM2.5 by winter, derived data and tests
- JanVayu, Delhi days by AQI category and month, 2016 to 2025, from CPCB's daily bulletins
- CEEW, "How kharif farm fires hit Delhi harder than rabi fires", 22 May 2026
- Mangaraj et al., "Weak coupling of observed surface PM2.5 in Delhi-NCR with rice crop residue burning in Punjab and Haryana", npj Climate and Atmospheric Science 8, 18 (2025)
- Nandi, Ganguly, Habib and Dey, "Delhi cannot clean its air alone: airshed-scale mitigation outperforms local controls even under unfavourable winter meteorology", npj Clean Air 2, 27 (2026), CC BY 4.0
- CPCB, National Air Quality Index methodology (2014), for the PM2.5 breakpoints, and National Ambient Air Quality Standards (2009), for the 24-hour value of 60 µg/m³
- Calendarific, dates of Diwali in India, 2016 to 2028
- JanVayu, "Was it policy, or was it the wind?"