Published: 17 September 2026 | Author: Team JanVayu | Reading time: 6 min
Nine days ago we published a post about Delhi called Was It Policy, or Was It the Wind? It explained a problem and then admitted a limit: we could separate a real change in the air from a change in the weather, but only for one city, and only for two months of the year. We wrote that nothing in it transferred to Kanpur or Patna or Bengaluru, and that we were not going to imply otherwise.
The method was never the limit. The data was: we could not get hold of enough of India's hourly monitoring record to run the same analysis anywhere else.
Now we can, and here is what it says for 44 cities across 2018 to 2024.
What the method does, in one paragraph
A city's monitors read high in a still, cold week and low in a windy, wet one, even if the traffic and the kilns and the construction have not changed at all. So for each city we let a model learn how that city's daily PM2.5 responds to its own wind, temperature and humidity, alongside the things that are not weather but still vary: the season, the day of the week, which station reported. Then we hold the date and the station fixed, swap in weather drawn at random from that city's whole record, and average over thirty draws. What survives is the part the weather cannot explain. The technique comes from Grange and colleagues (2018) in Atmospheric Chemistry and Physics, and it is the same one Hawa Ka Hisab uses.
The falls are real, and they are concentrated
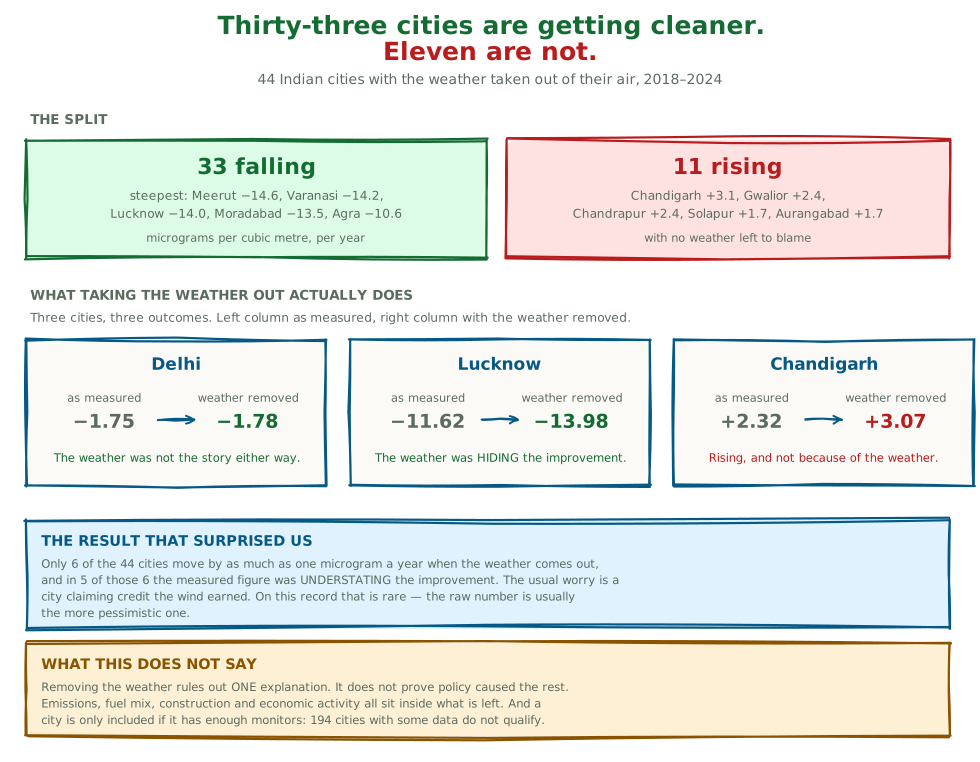
The steepest improvements are concentrated. They sit in Uttar Pradesh and the western edge of the National Capital Region: Meerut at −14.63 micrograms per cubic metre a year, Varanasi at −14.19, Lucknow at −13.98, Moradabad at −13.51, Agra at −10.61.
These are large numbers. A city falling at fourteen micrograms a year is falling by roughly the whole WHO annual guideline every four months of trend. Most of them also started among the highest in their first year in the record (Agra did not, and Meerut's series begins in 2019; figures in data/deweathered-national.json), which is part of why there was so much room to fall.
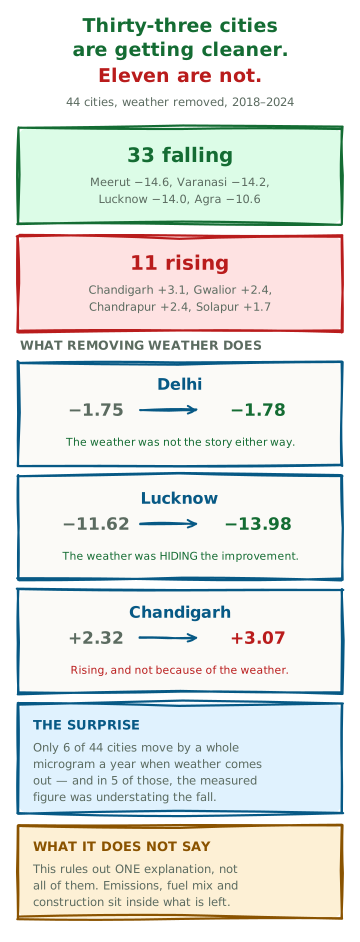
Eleven cities went the other way: Chandigarh at +3.07, Gwalior at +2.37, Chandrapur at +2.36, Solapur at +1.73, Aurangabad at +1.71, and six others, Mumbai (+0.80) among them. For these there is no weather left to point at. Whatever is happening in them is happening in the emissions.
The result we did not expect
The reason to take weather out is usually suspicion. A city announces an improvement; you wonder whether it just had a windy few years.
On this record, that is rare. Only 6 of the 44 cities move by as much as one microgram a year when the weather comes out, and in 4 of those 6 the measured figure understated the improvement. Lucknow reads −11.62 as measured and −13.98 with weather removed. Meerut reads −12.35 and −14.63. (In the other two, Agra and Pune, the measured fall was the larger.) In those cities the weather across 2018 to 2024 was working against the emission cuts, and the raw numbers were the more pessimistic ones.
For most cities, including Delhi, removing the weather barely moves the answer at all. Delhi reads −1.75 measured and −1.78 adjusted. Whatever is going on in Delhi, the wind is not the explanation in either direction.
What this does not say
This does not prove that policy caused any of it. Removing weather rules out one explanation. Emissions, fuel mix, construction, industrial output and how much economic activity a city had in a given year all sit inside what is left. A falling city is one whose air improved for reasons other than the weather. This analysis cannot say which reasons.
These are trends, and they say little about any single year. We report no confidence intervals here. The Delhi-only study did, and used them to decline to call a direction for September and October. This run trades that precision for breadth: thirty weather draws per city across 44 cities rather than sixty draws and two hundred bootstrap replicates for one. Treat the direction as the finding and the second decimal place as decoration.
The question is also different from the one the Delhi post asked. That one looked at September and October, 2018 to 2022. This looks at whole years, 2018 to 2024. A city can be flat in two months and falling across the year without either finding being wrong.
A city is only here if it has enough monitors: at least two stations, 1,800 station-days, and five of the seven years. 194 cities with some data did not qualify. That says nothing about those cities and a good deal about where India has put its instruments.
Where the data came from
The reason this was impossible in September and possible now is a single open dataset. The India Air Quality Database, published by XKDR Forum under CC BY 4.0, compiles the Central Pollution Control Board's continuous monitoring network into one table: 196.5 million hourly readings from 558 stations. Before it, getting a few years of hourly data for one city was laborious.
One caveat we hit, and have documented, is that the archive's coverage thins sharply after 2024: CPCB's feed into it stops on 1 September 2025. That is why this study ends in 2024 rather than running to the present.
If your city is in the 44 and the number surprises you, we would like to hear why. Local knowledge has caught more of our mistakes than any check we have written. And if your city is in the 194 that did not qualify, the reason is that nobody has put enough monitors in it, which is worth asking your municipal corporation about. Write to us at contribute@janvayu.in.
Sources. PM2.5 from the India Air Quality Database (XKDR Forum, CC BY 4.0), compiling the Central Pollution Control Board's Continuous Ambient Air Quality Monitoring network and US Department of State monitors via AirNow. Meteorology from the Open-Meteo archive, hourly, at each city's station centroid. Method after Grange et al. (2018), Atmospheric Chemistry and Physics 18, 6223–6239. Full working in scripts/build-deweathered-national.py; the per-city figures are in data/deweathered-national.json.