Published: 8 August 2026 | Author: Team JanVayu | Reading time: 5 min
Until yesterday, finding out how polluted your neighbourhood is meant knowing something you should not have to know: whether the place you live is officially a ward or a village.
Wards were in one panel, behind a dropdown of 142 cities. Villages were a layer on a different map. If your town was not in the dropdown, you got nothing. Nobody chose that on purpose. The way our data was stored had leaked into the menus.
The live map now has a single Boundaries menu covering the whole administrative hierarchy of India:
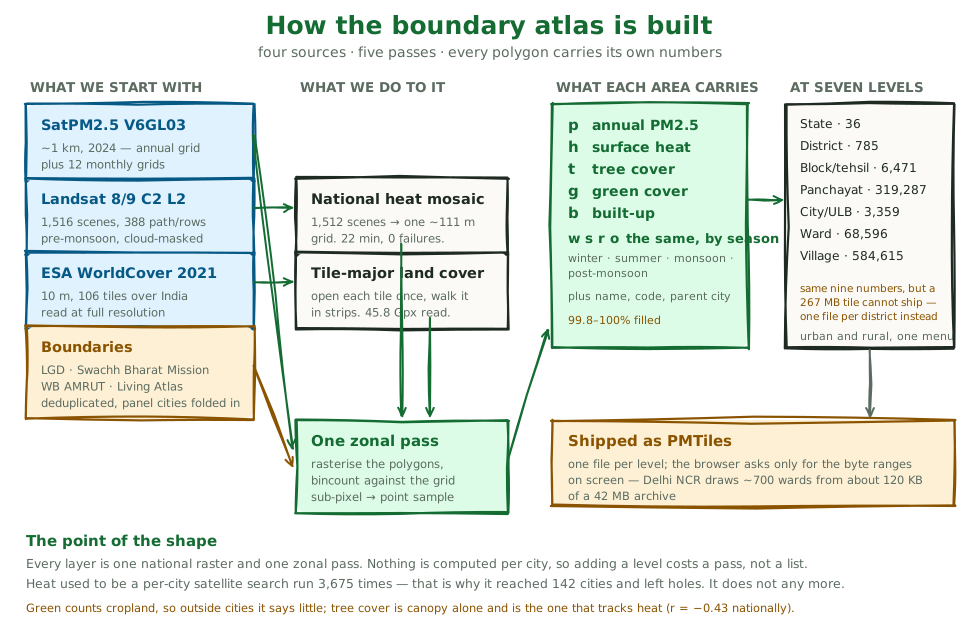
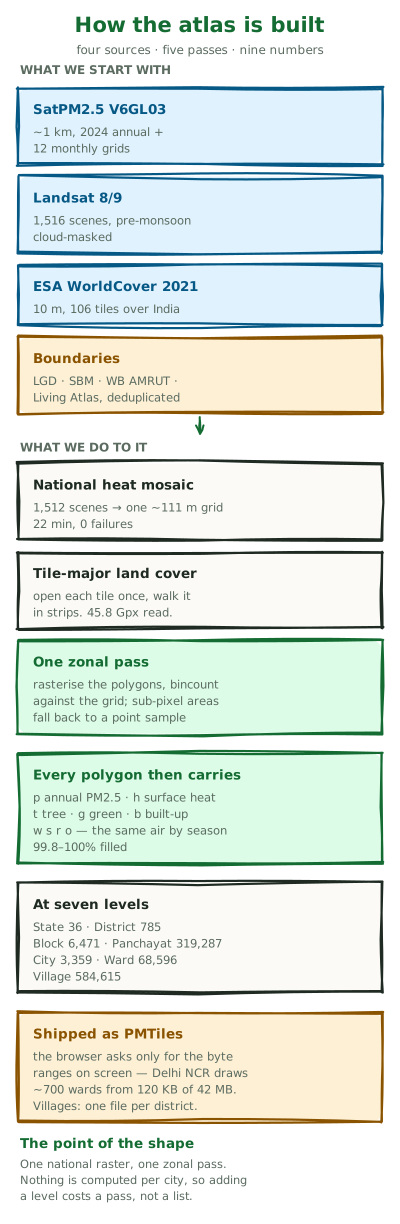
State → district (zila) → block, mandal or tehsil → gram panchayat → village, on the rural side. City or ULB → ward, on the urban side.
Every level is coloured by its annual satellite PM2.5. Pick a level, zoom to where you live, tap.
What this adds
All 70,417 municipal wards in the country, not the 142 cities someone had got round to adding. The dropdown is gone; wards are what you see under the map when you zoom in far enough. Bhiwandi, Bardhaman and thousands of small municipalities nobody had listed are there now.
Update, 2 October 2026: after removing 2,541 duplicate records and adding 720 wards from 14 cities the sources missed, the atlas holds 68,596 distinct wards, not 70,417. "All wards in the country" overstated it, since those 14 cities were missing from the three sources. Noida is only partly covered (10 ward polygons).
319,287 gram panchayats. Most rural governance happens at this level, and we know of no other air-quality map that goes this far down.
6,471 blocks, mandals and tehsils, the level a district collector works with.
Keeping it fast
A naive version of this would be unusable. The village layer alone is 584,615 polygons.
So your browser asks only for the part of each level's data that covers what is on your screen, and downloads nothing else. Loading the Delhi region at ward level draws 671 wards (Delhi, Noida, Ghaziabad and Gurugram together) and transfers 109 KB. The old ward atlas downloaded 224 KB to show Delhi's 290 ward polygons (an older delimitation) alone. That is twice the data, four cities instead of one, and half the bytes.
Three quiet failures this build surfaced
We write these up because the dangerous failures in a data project are the quiet ones, where the output looks right and is not. Naming them helps the next build avoid them, and helps you judge what the numbers are worth.
Every one of 584,615 villages was briefly labelled with its state. Each government dataset spells its "name" column differently. Our code expected the column name to end in "name", but the real ones are vilname11 and vilnam_soi. It matched nothing, and a fallback we had written to be helpful grabbed the first name-like column in the file, which was the state. Nothing errored and the build reported success. Every village in India would have been labelled "BIHAR" or "KERALA".
We deleted the fallback. The build now stops and prints the actual column names, because a run that mislabels the whole country is worse than one that fails. A check across all seven levels immediately caught two more of the same kind.
Gram panchayats came out at 439 MB because we had drawn them at village-level detail, for a layer that only groups villages. Retuned, they take 68 MB with no visible loss.
We switched off the wrong compression. The map's data files must not be compressed by the delivery network, or the browser cannot ask for just the part it needs. We misread that as "don't compress the data inside the files either", which is a different thing and only made every file bigger by 13%. We measured the cost, then fixed it.
What is still not right
Villages use the old loader underneath. Their data file is 267 MB and GitHub refuses files over 100 MB, so it cannot ship the way the other six levels do. You will not notice, since it is the same menu and the same place in the hierarchy, but it is a workaround.
An annual mean is still the wrong tool for a country whose pollution swings so sharply with the season. Every number on these layers is a 2024 average. It says nothing about a bad week in November, which for the Indo-Gangetic plain is most of the story. A monthly layer is the most valuable thing we could build next.
Update, 2 October 2026: the map also carries four-season air, 2026 pre-monsoon heat and 2021 land cover, so "every number is a 2024 average" no longer holds (it was already inaccurate for heat and land cover on 8 August).
The old ward panel is still there, because it does things the map does not yet: summer heat, green cover, built-up share, and the schools and health-centre overlays. It now points here, so nobody whose city is missing from its list hits a dead end.
Update, 2 October 2026: the ward panel was retired in v26.6.151; its #ward-map link now points to the map.
Find your place at janvayu.in: press Boundaries, pick your level, zoom in. If your panchayat's name is wrong, or your ward boundary does not match what you know on the ground, tell us at contribute@janvayu.in. Local knowledge beats another pass over the data by us.